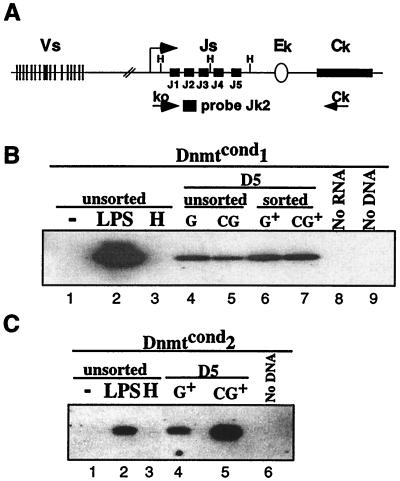
Figure 4.
Loss of methylation at the kappa locus activates transcription in Dnmtcond2. (A) Schematic diagram of the murine kappa locus. The large arrow designates the promoter of the ko transcript. The primers ko and Ck used for PCR and the Jk2 primer used as a probe to detect the ko product are shown schematically. (B) RT-PCR analysis of the expression level of ko in the Dnmtcond1 line under different conditions. Lanes 1–3 are unsorted cells either untreated (lane 1), or treated with LPS (lane 2) or HC toxin (lane 3) for 24 h. Lanes 4–7 are derived from cells 5 days postinfection. The cells were either infected with MiGfp (G) or MCiGfp (CG). Lanes 4 and 5 are unsorted infected cells, and lanes 6 and 7 are Gfp+ sorted cells. Lane 8 is the product of an RT-PCR with no RNA template. Lane 9 is the product of a PCR assay with no DNA template. (C) RT-PCR analysis of expression of ko in the Dnmtcond2 line under different conditions. Lanes 1–3 are unsorted cells either untreated (lane 1), or treated with LPS (lane 2) or HC toxin (lane 3) for 24 h. Lanes 4 and 5 are derived from cells sorted for Gfp expression 5 days postinfection either infected with MiGfp (G) or MCiGfp (CG). Lane 6 is the product of a PCR assay with no DNA template.

