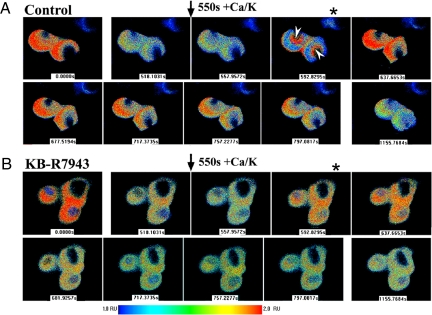
Fig. 4.
Ratio images of [Ca2+]ne/er in differentiated NG108–15 cells. Serial images were obtained with ER-cameleon-expressing cells as described in Fig. 3. (A) Control (no KB-R7943): Following Tg application at 50 s leading to depletion of [Ca2+]ne/er, addition of CaCl2/KCl at 550 sec caused elevation of [Ca2+]ne/er that originated in the perinuclear region (arrowheads at 592.8 s image with *) and then extended to entire NE/ER. This was followed by gradual Tg-induced depletion. (B) Repeat of above experiment with KB-R7943 showed limited uptake of Ca2+ in the perinuclear region at 592.9s (*) consistent with incomplete blockade shown in Fig. 3 Aa and Ba; modest rise in [Ca2+]ne/eroccurred briefly to 637.7 s followed by gradual Tg-induced depletion.

