
Figure 2.
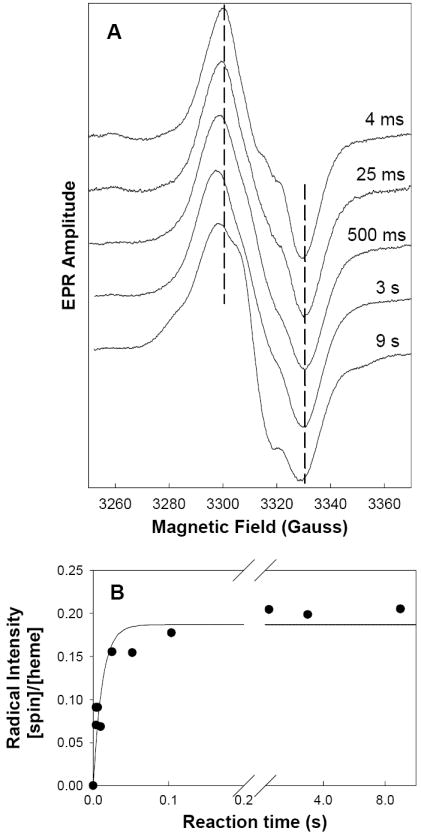
Radicals EPR signals during reaction of hPGHS-1 with EtOOH. (A) hPGHS-1 (47 μM heme) in 100 mM KPi, pH 7.2, 0.1% Tween-20, 10% glycerol was reacted at room temperature with 5 equiv of EtOOH for the indicated times before the sample was freeze-quenched and the EPR spectrum recorded. Vertical dashed lines indicate the peak and trough positions in the 4 ms spectrum. (B) The radical intensity in each sample was determined by double integration and normalized to the hPGHS-1 heme concentration. The line represents the first-order fit to the data.