
Figure 4.
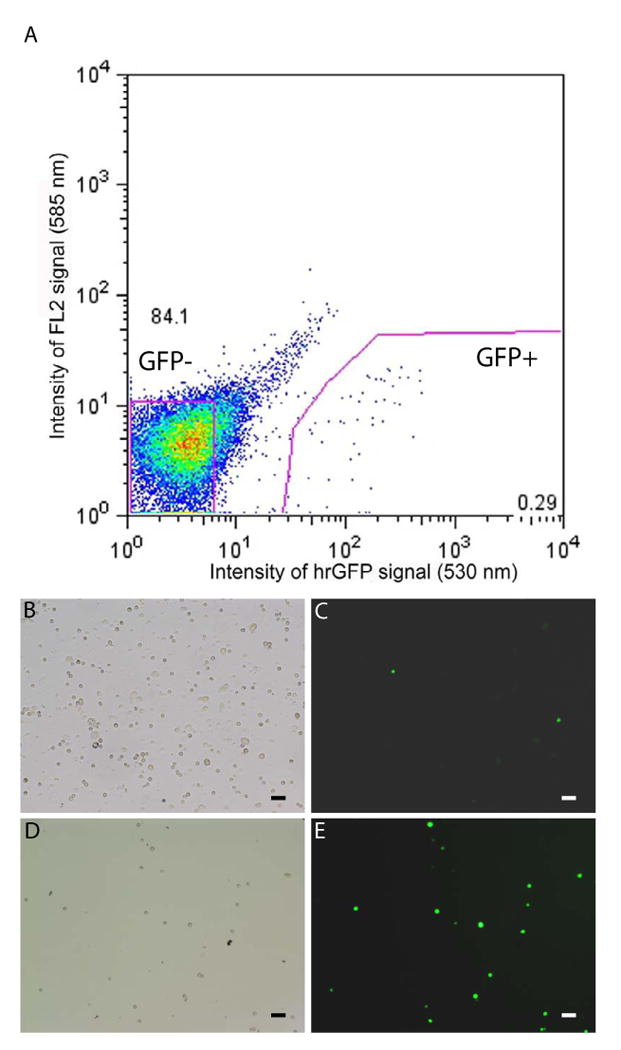
Fluorescence activated cell sorting of ghrelin-hrGFP cells. A) Graphical representation of FACS of gastric mucosal cells (preparation 1), indicating those cells collected as part of the hrGFP-enriched pool (0.29% of the total number of sorted, living cells) and those collected as part of the hrGFP-negative pool (84.1% of the total number of sorted, living cells). A-D) Photomicrographs of dispersed gastric mucosal cells prior to FACS (B-C) and after FACS (D-E), demonstrating an enrichment in the numbers of total cells (B, D) that contain hrGFP (C, E). Scale bars = 50 μm.