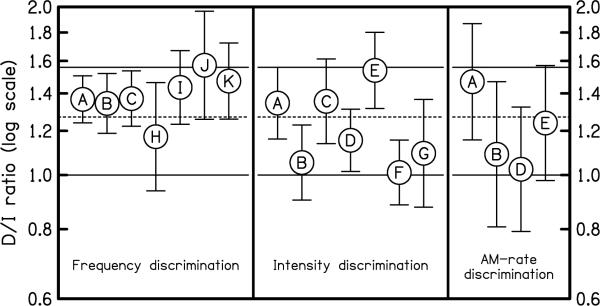
Figure 2.
Mean individual D/I threshold ratios measured in 11 listeners (A, B, C, … K) for three sound attributes (frequency, intensity,, and AM-rate). Values greater than 1.0 indicate that the threshold for detection of a change is higher than the threshold for the identification of the direction of the change. Note that only two listeners (A and B) were tested on all three attributes. Error bars indicate the 95% confidence intervals around the mean ratios, estimated using statistical resampling (bootstrap). The two solid horizontal lines indicate the predictions of the CVG model (a ratio of 1.56) and of the HT model (a ratio of 1.00). The geometric mean of the 18 plotted D/I ratios is indicated by a dashed line.

