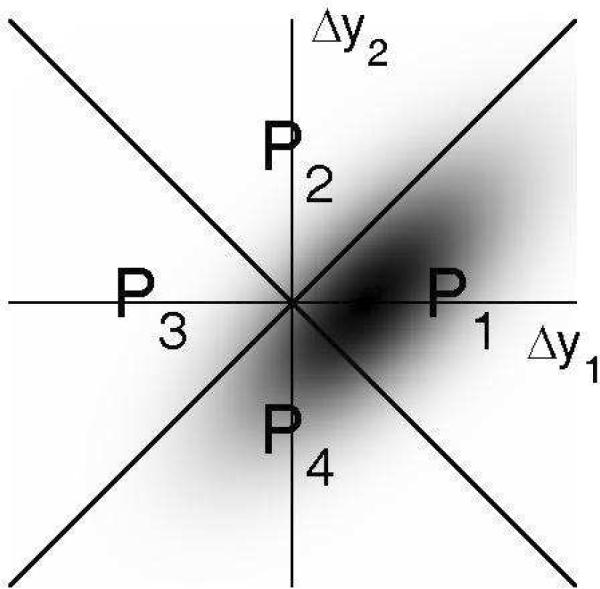
Figure 3.
Decision space for the CVG model with fluctuating bias added to the decision variables, Δy1 and Δy2 In this example, the bias-related noise has a normal distribution with a standard deviation twice as large as that of the sensory noise. As manifested by the elliptical shape of the PDF, and its diagonal orientation, this type of bias introduces a correlation between the two decision variables. This correlation contributes to reduce the proportion of correct responses, compared to the case where no such bias is present (Figure 1).

