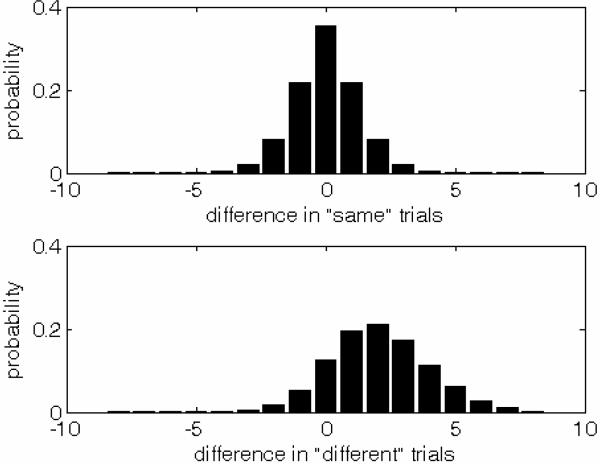
Figure 7.
Example probability distributions for the “difference between observations” decision variable in the Poisson model. The two panels in this figure show how the decision variables are distributed on “same” trials (upper panel) and on “different” trials (lower panel). These distributions are for a Poisson process with a mean spontaneous rate, μ0, of 0.8 spikes per second and a mean evoked rate of 2.9 spikes per second.

