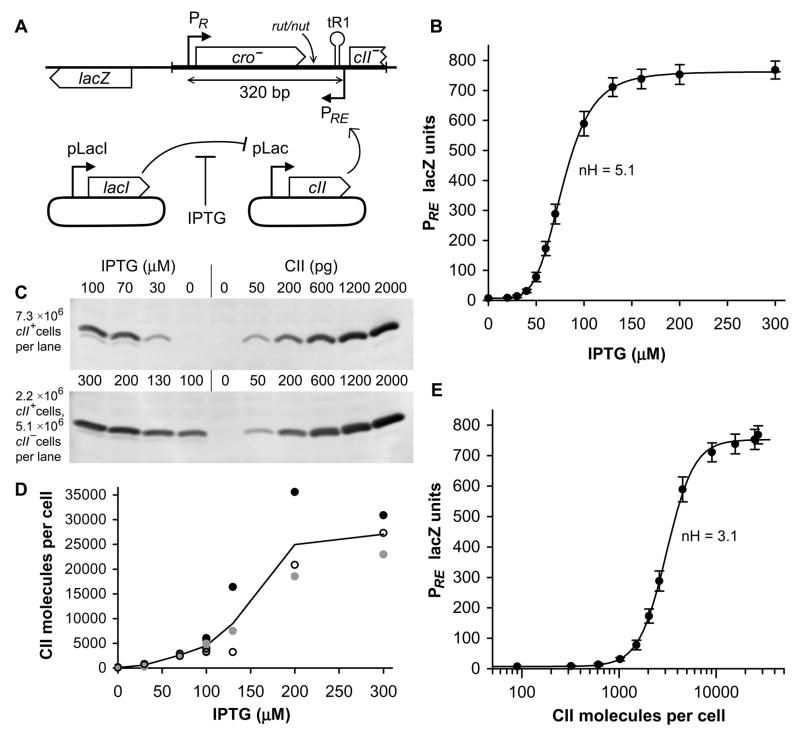
Figure 1. Activation of PRE by IPTG induction of CII.
A) Diagram of single-copy chromosomal lacZ reporter and plasmid system for IPTG regulated expression of CII. IPTG regulated expression of CII is achieved with a two plasmid system: pUHA1 contains pLacI-lacI and pZS15cII contains pLac-cII. The region of lambda used in the reporter system is shown as a thicker line. The relative locations of the Rho utilisation site (rut), N utilisation site (nut) and the tR1 terminator are shown.
(B) Activity of PRE.(PR−).lacZ (n=12) as a function of IPTG, which induces expression of CII from pLac in pZS15cII. Error bars in this and all subsequent figures are 95% confidence limits. The line connecting points is the Hill function of best fit. The average Hill coefficient is 5.1±0.4 (95% confidence limits).
(C) Western blotting of CII from E. coli pUHA1 pZS15cII grown in a range of IPTG concentrations, quantitated against a calibration curve of pure CII protein added to cII− E. coli extracts. For the IPTG concentrations 100 to 300μM (lower panel), cII+ extracts were diluted 3.3-fold into cII− extracts, to give a quantity of CII that lies within the calibration curve. The 100μM IPTG point was measured in both diluted and undiluted form, giving average measurements within 6% of one another.
(D) Quantitation of CII western blotting, showing the results of three independent sets of western blots (filled, open, and grey). Grey circles are the data of (C), and a continuous line shows the average of all data.
(E) Activity of PRE.(PR−).lacZ plotted as a function of CII molecules per cell. Using the western blotting of (C) and (D), CII molecules per cell were measured for 7 IPTG concentrations. CII molecules per cell for those IPTG concentrations not directly measured were determined by interpolation between measured data. The average Hill coefficient is 3.1±0.3 (95% confidence limits). Assuming an average cellular volume of 1.4 fL, we can determine from this data that the in vivo affinity of CII for its binding site is KD = 3.7 μM.

