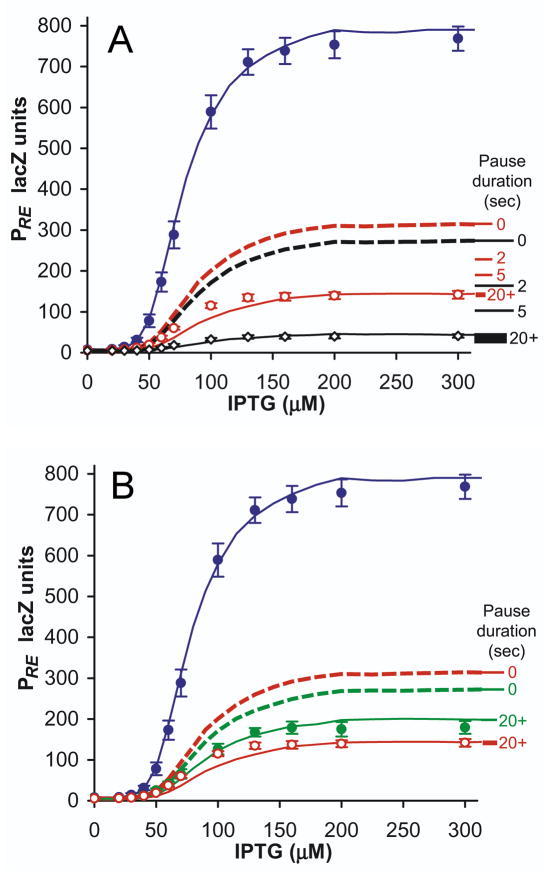
Figure 6. Occlusion by paused RNAP can explain the strong transcriptional interference of PRE.
(A) Experimental and simulated TI of PRE, in rutA+ and rutA− conditions, with simulations incorporating occlusion by paused RNAP. Points are experimental data: PRE.(PR−).lacZ (blue), PRE.(PR+).lacZ (red), and PRE.(rutA− PR+).lacZ (black) (n=7). PRE.(rutA− PR+).lacZ has been scaled up to normalise PRE activity in the absence of TI, to facilitate comparison of fold-interference against rutA+ constructs; this is necessitated by rutA− causing a 27% decrease in PRE LacZ activity in the absence of TI. Lines are stochastic simulations of TI: dotted lines are simulations without RNAP pausing at tR1, and solid lines are simulations with intrinsic RNAP pause durations at tR1 of 20 seconds. Marked along the right of the graph are the predicted maximum activities of PRE.(PR−).lacZ (red) and PRE.(rutA− PR+).lacZ (black) with intrinsic pause durations of 0, 2, 5 and 20+ seconds, illustrating how pausing of RNAP progressively increases repression of PRE. The thickness of the 20+ second line spans the range of promoter activity calculated for pause durations from 20 to 1000 seconds.
(B) As for (A), showing the effects of reduced pausing due to λN in green: PRE.(PR+ N+).lacZ (n=10). Expression of λN had no influence upon PRE.(PR−).lacZ (data not shown).

