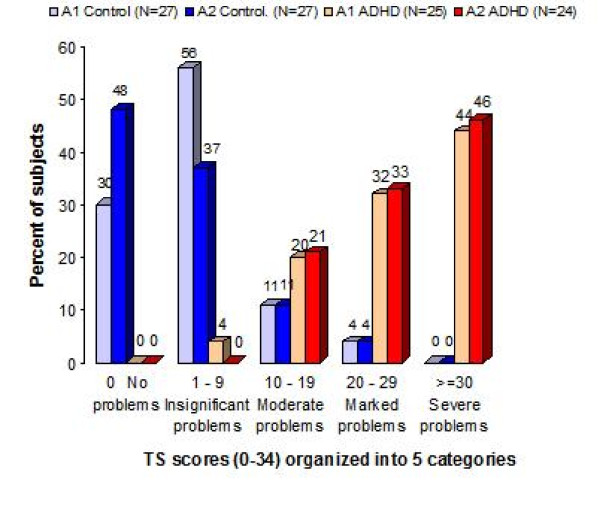
Figure 1.
Distribution of TS scores for the Assessment 1 and Assessment 2. The percent distribution of the 'Total score'. The graph presents the distribution of the 'Total scores' for the ADHD and the non-ADHD control group on assessment 1 (ADHD group N = 25; control group N = 27) and assessment 2 (ADHD group N = 24; control group N = 27), with the 'Total score' scores ranging from 0–34, grouped into 5 intervals.

