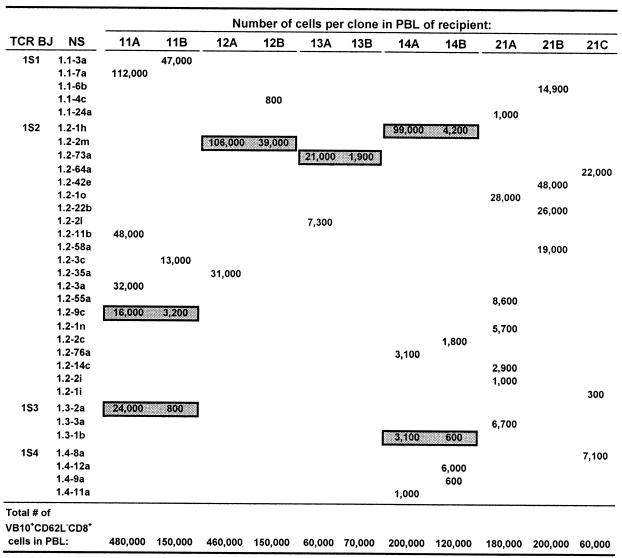
Table 3.
Relative expansion of clones selected during the CW3 response in single-donor and multiple-donor AT mice
For each clone expressing the indicated VB10 TCR, the number of cells circulating in the blood was calculated from the number of lymphocytes recovered by cardiac puncture, the phenotypic analysis of the PBL, and the proportion of sorted VB10+CD62L−CD8+ cells that express the TCR [Tables 1 and 2; supplemental Table 6 (www.pnas.org), and data not shown].

