
Figure 8.
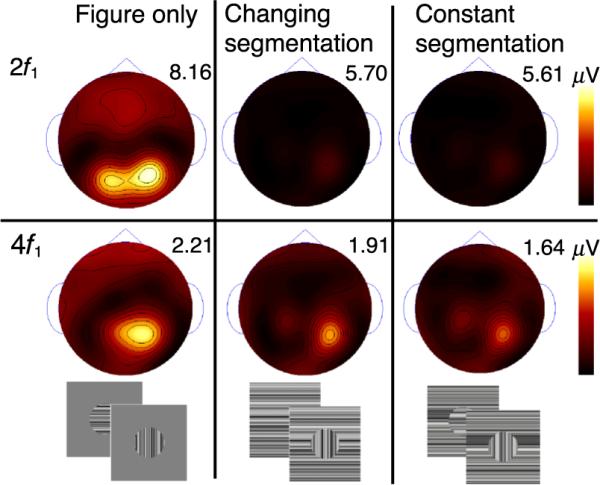
Figure region response distribution at the second (top) and fourth harmonic (bottom) under three background contexts. Response maxima are indicated above each map, and maps for each row are on the same scale. Two stimulus frames for each condition are presented below.