
Figure 4.
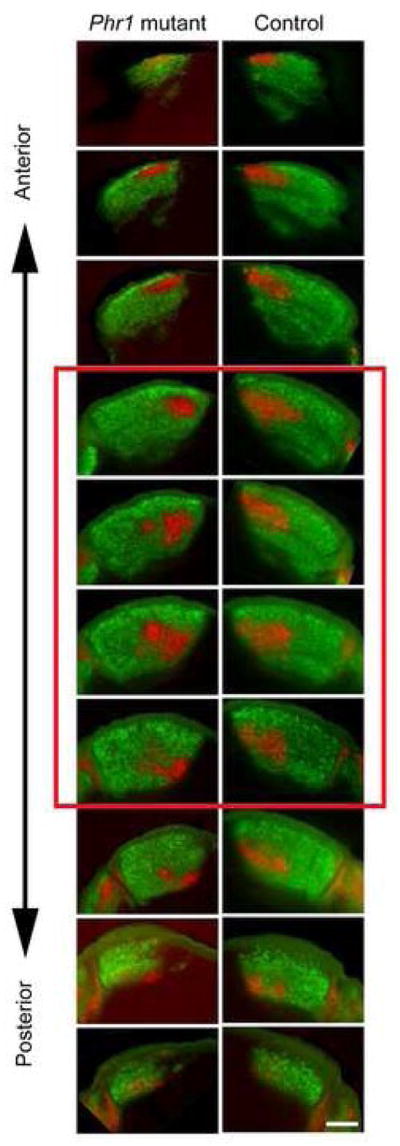
Quantification of size and overlap of projections. Calculations for both the size of the ipsilateral projection and the R-value distribution for any individual animal were obtained using the average value of 3 to 5 successive sections through the middle of the LGN (red square). The number of images used was determined by discarding the 3 most anterior sections and most posterior sections. Using this approach we found no difference in the area occupied by the ipsilateral patch in Phr1 retinal mutants vs. controls (see Fig 2). Because the ipsilateral patch is milocalized in the Phr1 retinal mutant, we performed a second analysis comparing the volume of the ipsilateral projection in the mutants and controls by calculating the area occupied by the ipsilateral projection for all images through the LGN, divided by the nucleus area in the same sections. Even with this alternate approach we found no significant difference (14.72% +/− 1.62% no Cre, n=3; 12.58% +/− 1.37% Math5-Cre, n=4). Scale bar = 200 μm.