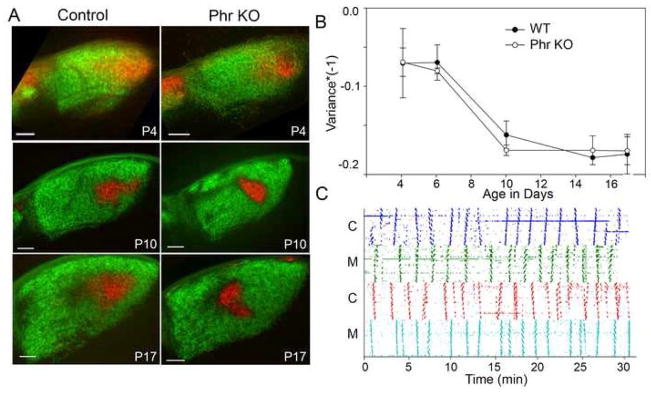
Figure 6.
Segregation and retinal wave activity is normal in Phr1 retinal KOs. (A) CTB labeled ipsi- (red) and contralateral (green) retinal projections in 80 μm coronal dLGN sections from control and Pax6-Cre, Phr1 mutant mice littermates at three time points showing progression of segregation. (B) The time course of segregation was analyzed using the threshold-independent variance of R-value distributions (Torborg and Feller, 2004) and is indistinguishable in mutants and littermate controls. (C) Phr1 retinal mutants generate spontaneous retinal waves. Activity from correlated RGCs using multielectrode array recordings (Demas et al., 2003) over a period of thirty minutes in control (C) and Phr1 retinal mutant (M) retinas from littermates at P10. Between activity bursts there are quiet stretches with uncorrelated spontaneous activity. Scale bars = 100 μm.

