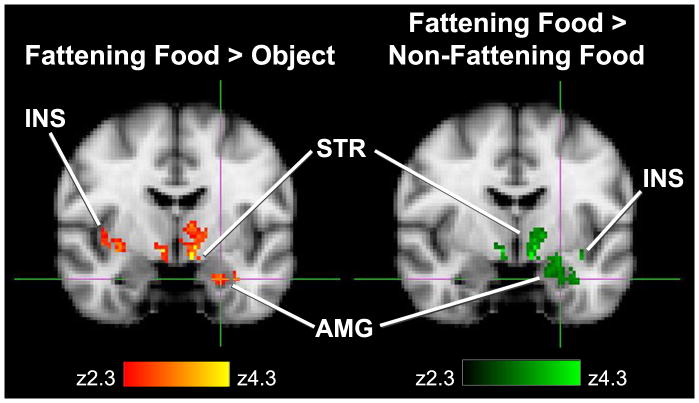
Figure 2. A comparison of brain activation in regions of interest based on choice of control condition.
Coronal sections through the amygdala (Talairach coordinates -24, -8, -24) for the contrasts of fattening food vs. objects and fattening food vs. non-fattening food. Significant clusters (P < 0.05 after correction for multiple comparisons) are presented by z-score (range 2.3 - 4.3). INS = insula; STR = striatum; AMG = amygdala

