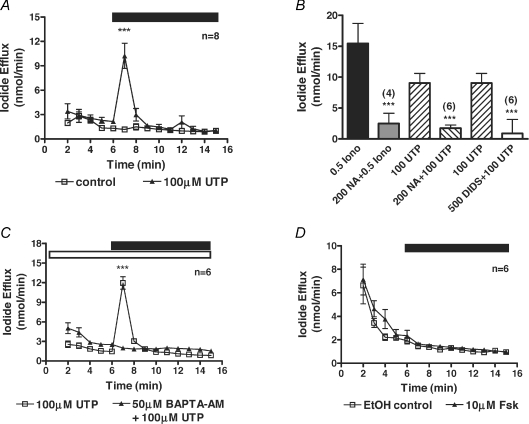
Figure 1. Characterisation of native CaCCs in CFPAC-1 cells by iodide efflux.
A, mean data showing the increase in iodide efflux on addition of 100 μm UTP. B, summary data for the inhibition of either the ionomycin-induced (0.5 μm) or UTP-induced (100 μm) iodide effluxes with the chloride channel blockers niflumic acid (NA, 200 μm) and DIDS (500 μm). C, mean data showing the inhibition in the 100 μm UTP-induced iodide efflux by 50 μm BAPTA-AM. D, mean data showing the lack of stimulation of iodide efflux on addition of 10 μm forskolin. During the periods indicated by the filled bar either 100 μm UTP or 10 μm forskolin was added to the efflux buffer. The open bar indicates the pre-treatment of cells with 50 μm BAPTA-AM during their loading with iodide and the compound's presence in the efflux buffer. Control traces represent the addition to the efflux buffer of either water in the UTP experiments, or ethanol in the forskolin experiments. Symbols and error bars are means ±s.e.m. (n values indicated on figure) for each condition. Where not shown, error bars are smaller than symbol size. ***Significantly different from control (P < 0.001).

