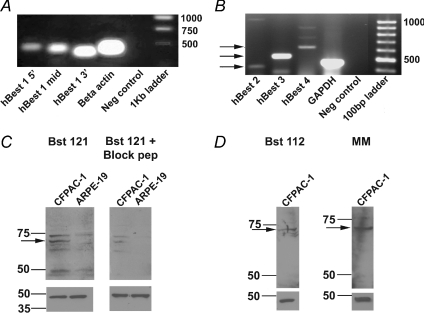
Figure 2. RT-PCR analysis of bestrophin gene expression and Western blot detection of hBest1 in CFPAC-1 cells.
A, RT-PCR (n= 4) showing the presence of hBest1 in CFPAC-1 cells as indicated by predicted product sizes (see Table 1) for primers representing the 5′, middle and 3′ regions of hBest1 nucleotide sequence (Lanes 1–3). β-Actin primers were used as a positive control (Lane 4) and no template RNA was added to the negative control (Lane 5). A 1 kb ladder was used to estimate the products' size (Lane 6). B, RT-PCR (n= 3) showing the presence of hBest2, 3 and 4 in CFPAC-1 cells as indicated by predicted product sizes (shown by arrows and see Table 1) for primers representing hBest2, hBest3 and hBest4 (Lanes 1–3). GAPDH primers were used as a positive control (Lane 4) and no template RNA was added to the negative control (Lane 5). A 100 bp ladder was used to estimate the products' size (Lane 6). C, detection of hBest1 in CFPAC-1 and ARPE-19 cells using a rabbit polyclonal antibody, Bst121 (1 : 750 dilution, Fabgennix; n= 3) to the hBest1 amino acid sequence (see Table 2 for details). A band at 68 kDa (indicated by arrow on upper left panel) corresponds to the hBest1 protein. A blocking peptide (Fabgennix) was added to the Bst121 antibody from CFPAC-1 cells and from ARPE-19 cells (upper right panel). D, detection of hBest1 in CFPAC-1 cells using a different rabbit polyclonal antibody, Bst112 (1 : 1000 dilution, Fabgennix; n= 3). A band at 68 kDa (indicated by arrow on upper left panel) corresponds to the hBest1 protein. A band at 68 kDa (indicated by arrow on upper right panel) was also detected using a mouse monoclonal antibody, BstMM (1 : 500 dilution, Fabgennix; n= 2) to hBest1. A β-actin antibody (1 : 10000 dilution, Abcam) was used as a loading control for all blots in C and D and is shown in the lower panels.

