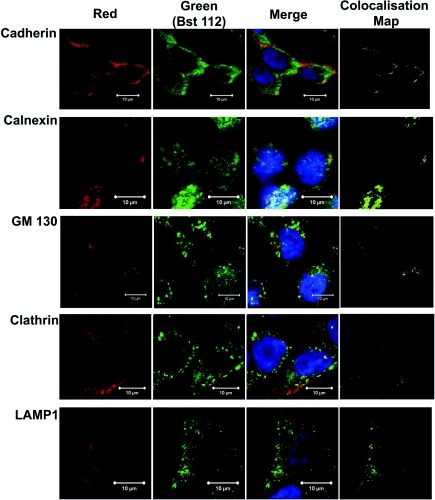
Figure 3. Confocal imaging of hBest1 expression and co-localisation with specific intracellular markers in CFPAC-1 cells.
The first column panels show expression of specific intracellular markers (red), cadherin (1 : 100 dilution; n= 3), calnexin (1 : 100 dilution; n= 2), GM130 (1 : 100 dilution; n= 3), Clathrin (1:100 dilution; n= 2), LAMP 1 (1:100 dilution; n= 2). The second column panels show expression of hBest1 (green) as determined using the Bst112 polyclonal antibody (1:200 dilution). The third column panels show the merged image of the first and second column panels. The fourth column panels are colocalisation maps created by the Volocity program. In all images hBest1 is fluorescently labelled with anti-rabbit Alexafluor 488 (green) and all specific membrane markers fluorescently labelled with anti-mouse Alexafluor 688 (red) and the nucleus of the cell labelled with DAPI (blue). Co-localisation is indicated by the yellow colour in the third column panels and the colocalisation maps of the fourth column panels. Scale bar given in each image corresponds to 10 μm. No background staining or autofluorescence was observed in CFPAC-1 cells when primary or secondary antibody was omitted (data not shown).

