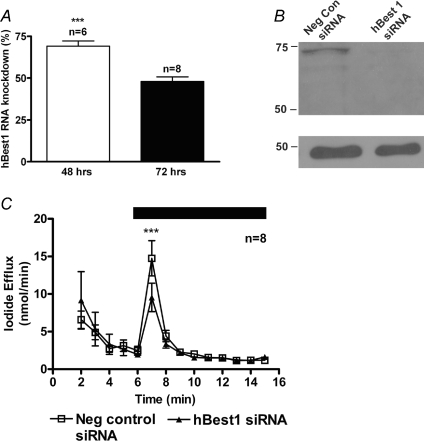
Figure 5. siRNA against hBest1 reduces calcium-activated chloride conductance in CFPAC-1 cells.
A, siRNA 03 and 05 (30 nm) were simultaneously transfected into CFPAC-1 cells using electroporation (Amaxa). Real time PCR analysis of isolated RNA demonstrated knockdown of 69 ± 3% (n= 6) at 48 h, which was reduced to 48 ± 3% (n= 8) by 72 h. B, Western blot analysis of extracted protein at 72 h after siRNA 03 and 05 simultaneous transfection showed that hBest1 protein had a considerably reduced band intensity of 79 ± 9% (n= 2). Detection of hBest1 in CFPAC-1 cells was performed using the rabbit polyclonal antibody, Bst112 antibody (1 : 750 dilution, Fabgennix). A band at 68 kDa corresponds to the hBest1 protein. A β-actin antibody (Abcam) was used as a loading control and is shown in the lower panels. C, iodide efflux analysis of CFPAC-1 cells after transfection with pooled 03 and 05 siRNA (30 nm; n= 8). Negative control siRNA was used to standardise the response (30 nm; n= 8). During the period indicated by the filled bar 100 μm UTP was added to the efflux buffer. Symbols and error bars are means ±s.e.m. (n values indicated on figure) for each condition. Where not shown, error bars are smaller than symbol size. ***Significantly different from control (P < 0.001).

