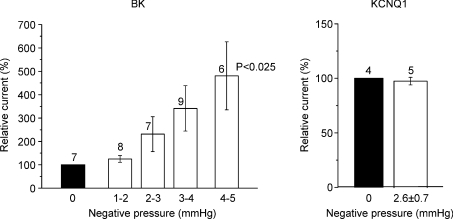
Figure 3. Effect of increasing negative pipette pressure on cell-attached macropatches containing BK or KCNQ1 channels for all experiments.
BK and KCNQ1 data are mean (±s.e.m.) currents measured at different pipette pressures compared to control (100%, 0 mmHg). For KCNQ1, a pressure of 2.6 ± 0.7 mmHg represents an average pressure of five experiments exposed to a pressure interval between 1.8 and 3.7 mmHg.

