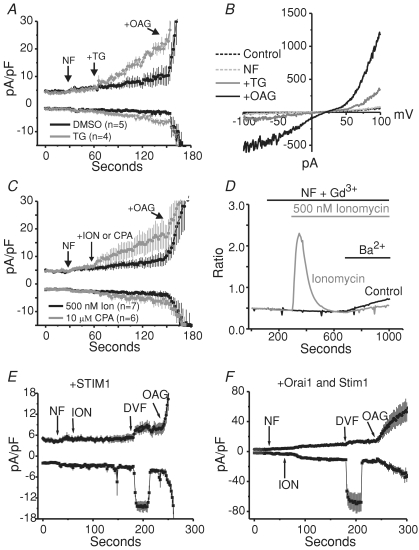
Figure 6. Thapsigargin-evoked increases in TRPC7 current.
A, whole-cell currents in HEK293 cells stably expressing TRPC7. Focally applied thapsigargin (n= 4, grey trace) increases outwardly rectifying currents in these cells, while DMSO does not (n= 5, black trace). Internal Ca2+ was clamped to around 100 nm free Ca2+, and external solutions were added as indicated by the arrows. Voltage ramps were applied from −100 mV to +100 mV (250 ms), every 2 s to record the currents which developed over time. B, representative current–voltage relationships showing the peak currents recorded after break-in (in the presence of 2 mm Ca2+, Control, dashed black trace), after switching to nominally Ca2+-free external solution (NF, grey dashed trace), after 1.5 min of focally applied thapsigargin (+TG, grey continuous trace), and after the application of 50 μm OAG (+OAG, black trace). C, experiments similar to A; however, using the ionophore ionomycin (n= 7, black trace) or the SERCA pump antagonist CPA (n= 6, grey trace), instead of thapsigargin. D, fura-2 AM imaging experiment showing the effects of ionomycin application (grey trace) compared to leak control (black trace). Ionomycin did not increase the rate of Ba2+ entry compared to the control. Shown are the means of single coverslips which are representative of three similar experiments for each condition. E, experiments (n= 7) similar to those inC (100 nm clamped Ca2+), in which ionomycin was used to deplete internal stores. However, in these cells, eYFP-STIM1 was transiently expressed and divalent cation-free (DVF) external solution was focally applied in order to demonstrate that ionomycin did indeed deplete the stores critical for ICRAC development. The inward currents seen after the application of DVF solution represent ICRAC. Note there is no depotentiation of these currents because the starting solution was devoid of Ca2+ (NF). F, same as in E; however, in conjunction with STIM1, Orai1 was also transiently expressed to further amplify the Na+-ICRAC currents recorded (n= 4). All whole-cell currents shown in this figure are represented as means ±s.e.m.

