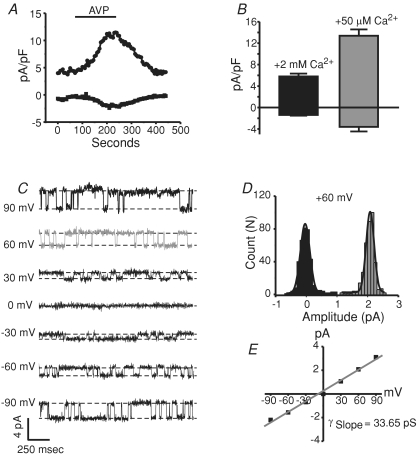
Figure 7. AVP-activated non-selective cation currents in A10 vascular smooth muscle cells.
A, a representative whole-cell current (−100 mV and +100 mV) recorded from an A10 cell before, during and after the focal application of 500 nm arginine–vasopressin (AVP). External solution contained 2 mm Ca2+ and the patch pipette contained 100 nm clamped Ca2+. AVP was applied as indicated by the line above the graph. Nimodipine (5 μm) was present throughout. B, bar graph depicting the effects of extracellular Ca2+ (HBSS + 2 mm Ca2+ or HBSS + 50 μm Ca2+) on the non-selective cation currents recorded in A10 cells after the application of AVP. C, single channel events recorded in the cell-attached mode from A10 cells bathed in 500 nm AVP application at the indicated holding potentials. The single channel events were not detected in experiments in which AVP was not applied (not shown). D, all points histogram showing the amplitude (pA) of the single channel events recorded after AVP treatment at a holding potential of +60 mV. E, current–voltage relationship of the single channel events and calculated slope conductance of the AVP-activated current.

