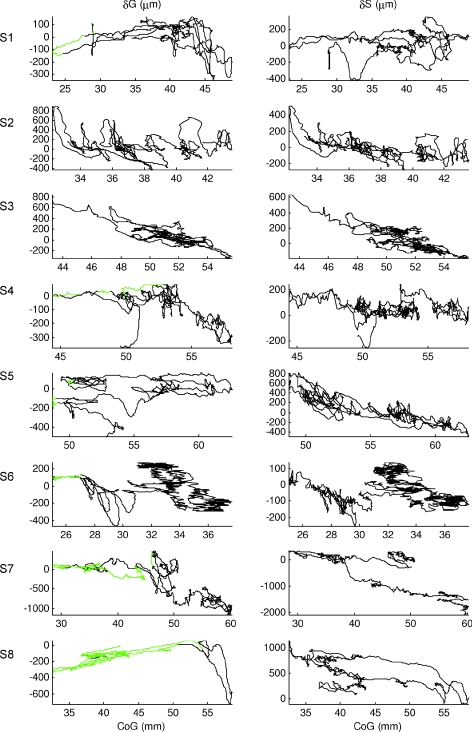
Figure 4. Calf muscles change in muscle length.
Gastrocnemius (left column) and soleus (right column) change in muscle length relative to CoG, during normal standing for all the other subjects (representative subject of Fig. 3 not shown). The green portions were manually identified from the surface EMG of gastrocnemius recognizing periods in which the activity was un-modulated. It is very clear that for several subjects the two calf muscles present a different behaviour: while soleus shows almost always a negative correlation with CoG, gastrocnemius, when CoG is nearer the ankle joint, shows also periods where the correlation with CoG is positive in some participants (S1, S4, S6, S8). Both muscles presented parallel lines when the muscles were un-modulated in their activity; their similar slope is an indication that even if the overall correlation is quite low, for short periods of time it might be high and for those durations the changes in muscle length appeared to be a good source of proprioceptive information. That is also the reason why we performed a trial partition analysis using intervals of 3 s.

