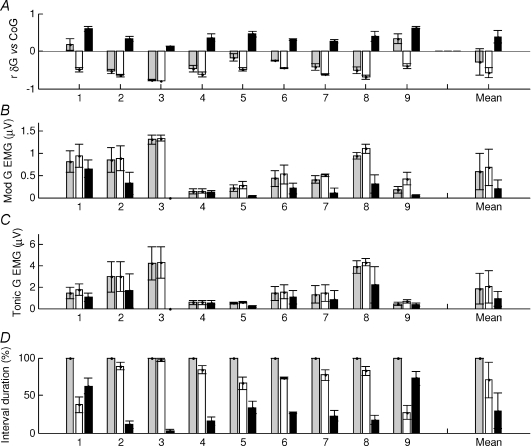
Figure 7. Gastrocnemius muscular behaviour during normal standing.
For each 3 s interval of a whole trial the correlation between gastrocnemius and the CoG was calculated. The intervals were classified into negatively (white bars) and positively correlated intervals (black bars) and whole trial (grey bars). For these groups the following quantities are shown: A, correlation between the gastrocnemius change in muscle length and the CoG; B, gastrocnemius standard deviation of EMG levels (modulation of activity); C, mean gastrocnemius EMG levels (tonic activity); D, percentage duration in each condition. The horizontal axis represents each subject tested (1–9); values are the mean for each subject and error bars show the standard error of the mean. The ‘Mean’ column is the average for all the individuals. On average gastrocnemius is negatively correlated with CoG (A) and the negatively correlated portion are associated with a higher level of modulation of EMG (B) and tonic activity (C). The negative correlated portions have the longest duration (D). The muscle lengths of S1 and S9 are overall positively correlated with CoG (A) and for longer duration (D) when the muscle activity is not modulated (B).

