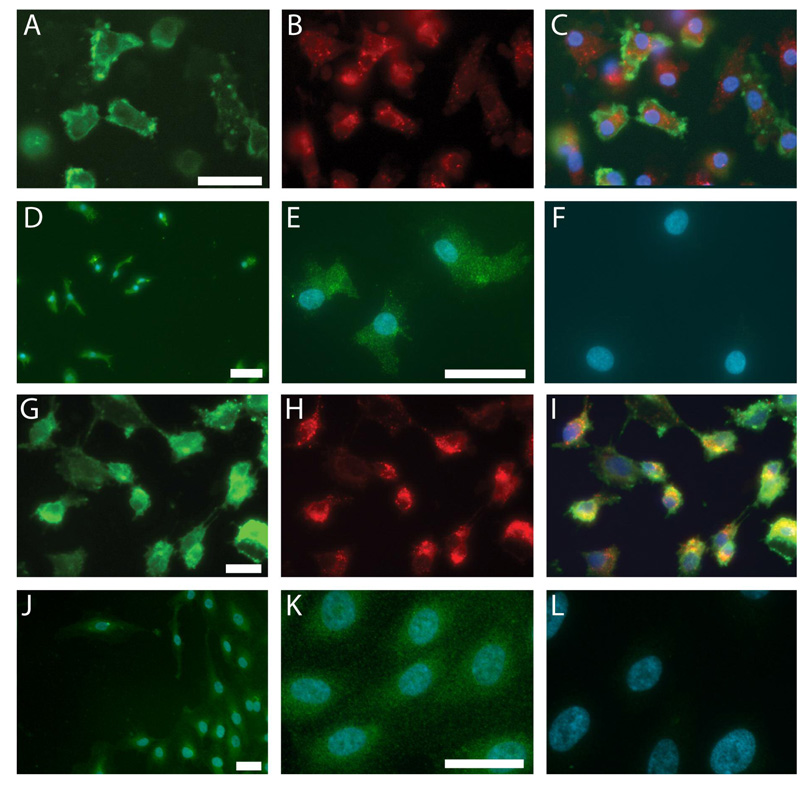
Figure 1. Characterization of EPCs (A–F) and HUVECs (G–L): lectin-binding, LDL-uptake, and eNOS expression.
EPCs and HUVECs exhibit UEA-1 lectinbinding (A,G) and acLDL-uptake (B,H). Merged image of both stains with blue nuclei (C,I). eNOS expression in EPCs (D,E) and HUVECs (J,K). Merged image of eNOS with blue nuclei. No primary antibody (F,L). Scale bars=20 µm.

