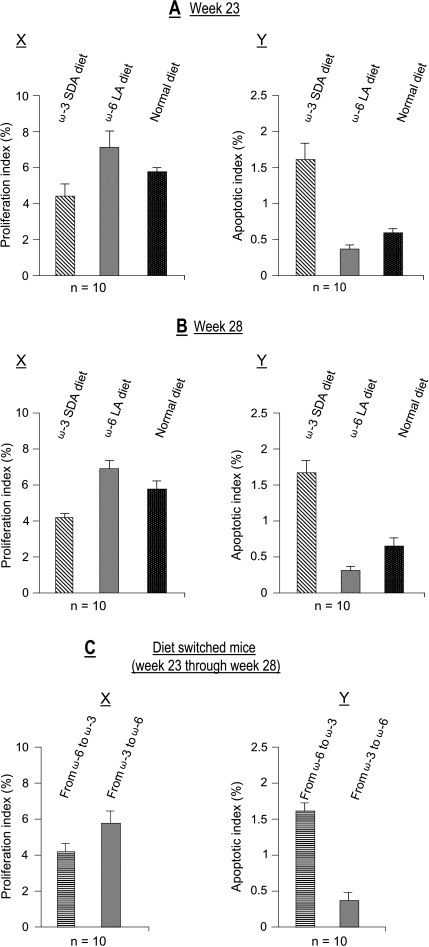
Figure 3.
Assessment in weeks 23 (A) and 28 (B) of proliferation (X) and apoptotic indices (Y) in tumors from mice fed with SDA ( ), LA (
 ), and normal diets (■). Similar assessments were performed as shown in diet-switched mice (C) (i.e., from LA to SDA [
 ] and vice versa [
 ]) after a 5-week period. Sections of formalin-fixed, paraffin-embedded tumor tissues were tested for the presence of Ki-67 (proliferation marker) and caspase-3 (apoptosis marker). Proliferation and apoptotic indices (%) were estimated as described in the Materials and Methods section. A total of n = 10 tumor tissues per group were examined.

