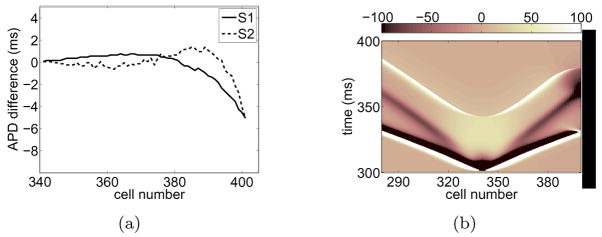
Figure 2.
(a) APD differences between cells near the wall and in the bulk extracted from Figure 1(b) for S1 and S2. (b) (Color online) Space-time plot of deposited diffusion current during S2. The plot shows the contribution to ∂tV from the first term on the right hand side of Eq. (1), ∇2V. The results were obtained from the simulation shown in Figure 1(b) and the values were rescaled to (−100, 100).

