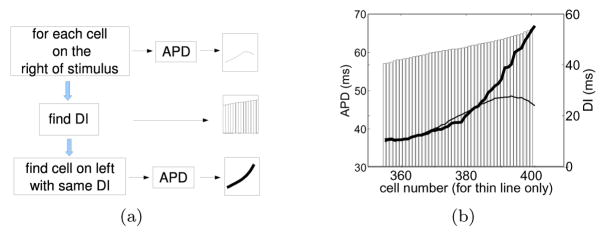
Figure 4.
Comparison of the APD-DI relation between cells near the wall and cells to the left of the stimulus site. (a) Procedure to construct the spatial restitution plot shown in (b). (b) Relation between APD and DI for S2 obtained from Figure 1(b). APD for cells near the wall (thin line, left and horizontal axes) are plotted together with the corresponding APD for cells on the other side of the site of stimulation that share the same DI (thick line, left axis, unspecified cell number). The common DI for each pair of APDs is shown as a bar (right axis).

