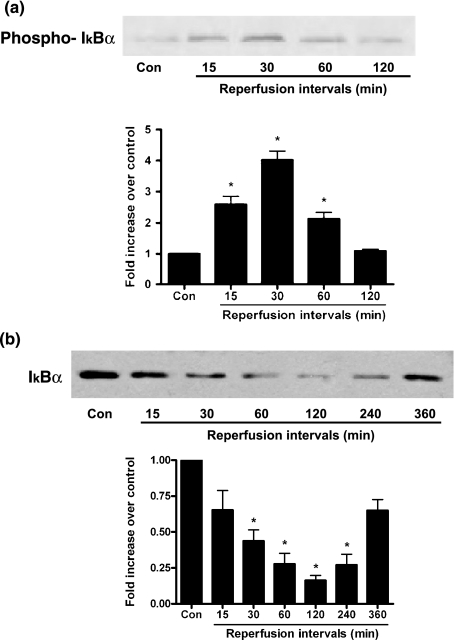
Figure 4.
Representative figures of Phospho-IκBα and IκBα protein expression during I/R. Total proteins were prepared from rat injured tissues during I/R and western blotting analysis was performed to determine the protein levels of (a) phospho-IκBα, (b) total IκBα levels. n=5–7 per group. Results are depicted as mean ± SEM. *Means P<0.05 vs. sham-operated (control).

