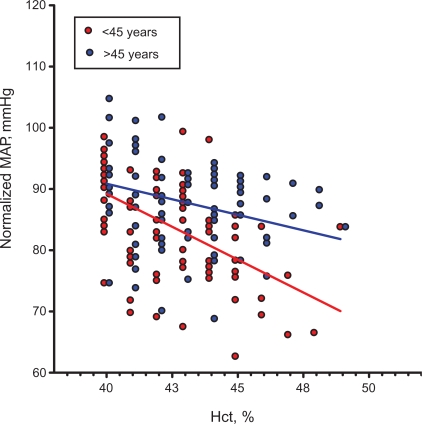
Figure 4.
Mean arterial pressure as a function of hematocrit (Hct), and therefore blood viscosity, when the effect of hematocrit is factored out (normalized MAP according to equation ) Both trends are statistically significant (p< 0.05 for <45 years and >45 years) as well as the difference in trends (p < 0.02).
Abbreviation: MAP, mean arterial blood pressure.

