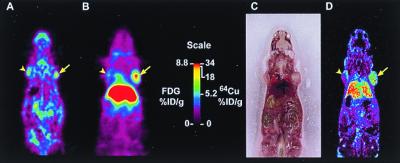
Figure 3.
(A) MicroPET scan of mouse administered 200 μCi 18F-FDG and scanned 1 h after injection. The mouse carried a C6 glioma xenograft on the left shoulder and an LS174T xenograft on the right shoulder (arrows). (B) MicroPET scan of the same mouse injected with 26 μCi 64Cu-anti-CEA minibody and imaged at 5 h with the highest retention in the LS174T tumor (arrow) and liver and lower retention in the control tumor (arrowhead). (C) Mouse was killed for whole-body autoradiography, and an anatomic photograph was taken at the time of sectioning. (D) Digital autoradiograph of adjacent section.

