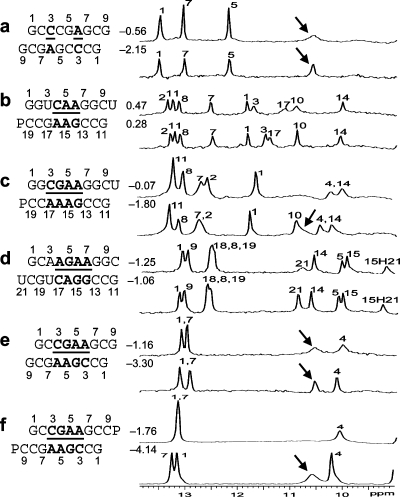
Figure 2.
One-dimensional imino proton NMR spectra in 80 mM NaCl, 10 mM sodium phosphate, and 0.5 mM sodium EDTA at 0 °C unless otherwise noted at different pH values, with the top spectrum of each RNA sequence acquired at near pH 7 and the bottom spectrum at lower pH. Assignments are preliminary and largely based on assignments for similar sequences. Values between sequence and spectra are ΔG°37,loop in kcal/mol measured in 1 M NaCl at pH 5.5 (bottom) and pH 7 (top). Resonances labeled with arrows are consistent with a previous assignment to the adenine amino protons in a CA+ pair (12). No resonances were observed between 14 and 16 ppm. (a) CT = 0.5 mM, pH 6.9 and 5.4; (b) CT = 0.3 mM, pH 6.9 and 5.0; (c) CT = 1.8 mM, pH 6.8 and 5.1; (d) CT = 0.5 mM, pH 6.9 and 5.3 (see Figure 3a for 2D spectrum); (e) CT = 0.5 mM, pH 6.9 and 5.9; and (f) CT = 1.5 mM, pH 6.6 and 5.1 (5 °C, see Figure 3b for the 2D spectrum).

