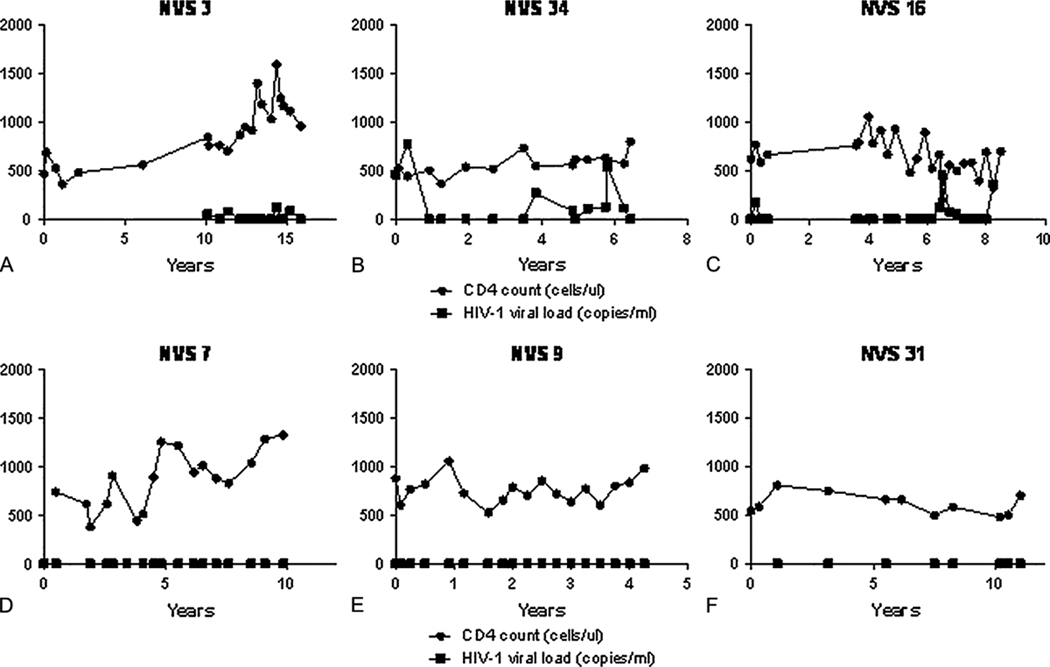
Figure 1.

Representative graphs of the different patterns of CD4 slope and viral control seen in the NVS. The Y axis represents CD4 cells/ul and HIV-1 copy number/ml (a value of 0 corresponds to a value below the sensitivity of the assay). As a group the CD4 slope ranged from −66 to + 205 cells/ul per year and CD4 % slope ranged from −3 to +4.44% per year (not shown). Figures A- intermittent detectable viremia in the presence of a rising CD4 slope (+74). Figure B- intermittent detectable viremia in the presence of a stable CD4 slope (−1) Figure C- intermittent detectable viremia in the presence of a falling CD4 slope (−26). Figure D- absence of viremia in the presence of a rising CD4 slope (+75). Figure E- absence of viremia in the presence of a stable CD4 slope (+6). Figure F- absence of viremia in the presence of a falling CD4 slope (−9).
