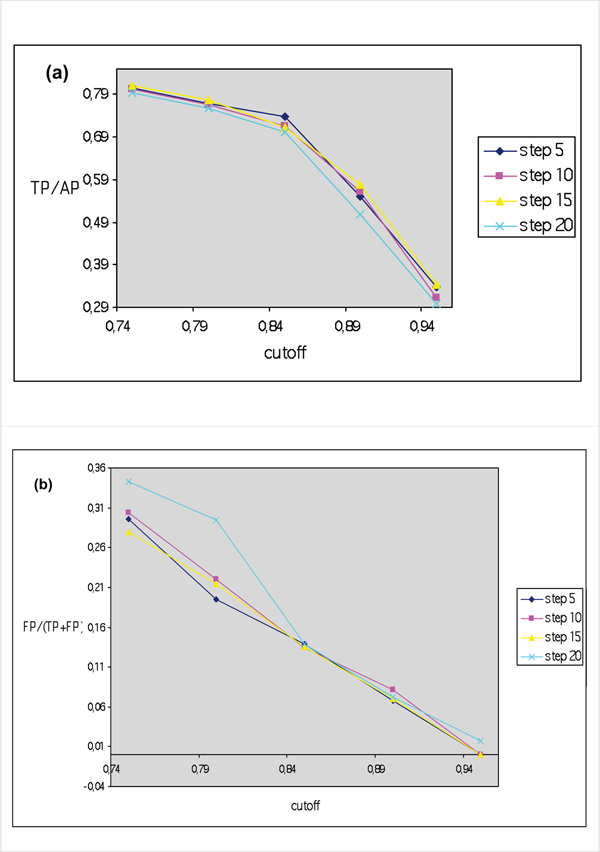
Figure 6.
(a) Selectivity (TP/(TP+FN)) trend and (b) False positive (FP)/(True Positives (TP) + False Positives (FP)) versus cut-off values at various step values, with minl fixed at 60 and window length at 20. Cut-off value of 0,85 produces the best results regards selectivity. Once again, step changes do not produce evident variations in number of positive results.

