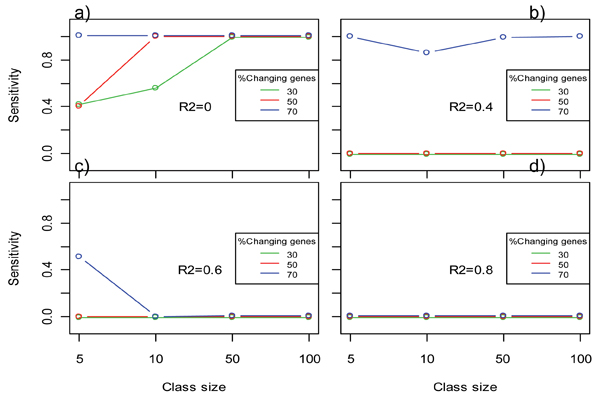
Figure 3.
Results of simulation study B with the maSigFun method. Changes in sensitivity with the size of the class at three levels of percentage of changing genes (co-expression) in the class. One plot is provided for each level of the goodness of fit R2 of the regression models. Data points correspond to the mean value of 50 simulations. Confidence intervals were omitted due to their negligible size.

