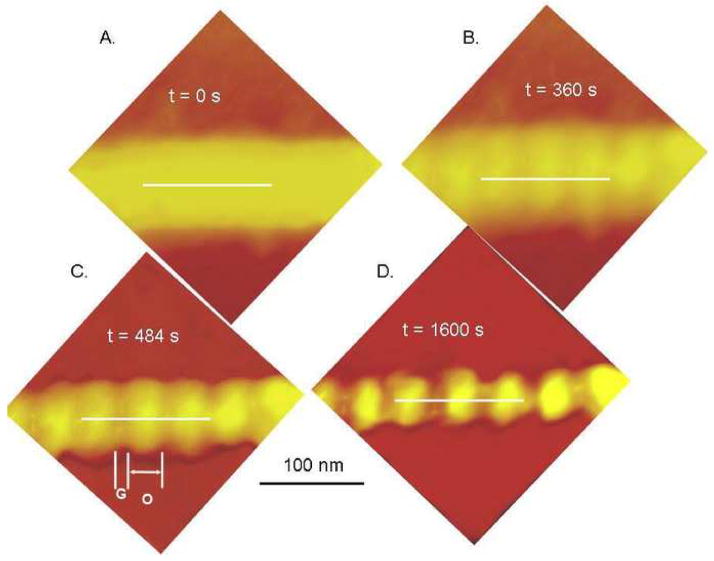
Figure 3.
Demineralization sequence in 10% citric acid of an isolated human dentin collagen fibril with white lines showing lines used to measure height variations in Fig. 4. A. initial appearance of the fibril was smooth and appeared to have indistinct boundaries. B. After 360 s of demineralization the underlying periodicity of the collagen fibril due to gap-overlap height differences was apparent. C. gap-overlap height differences increased with further demineralization at 484 s, labels G and O indicate gap and overlap zones, respectively. D.1600 s demineralization..

