Fig. 3.

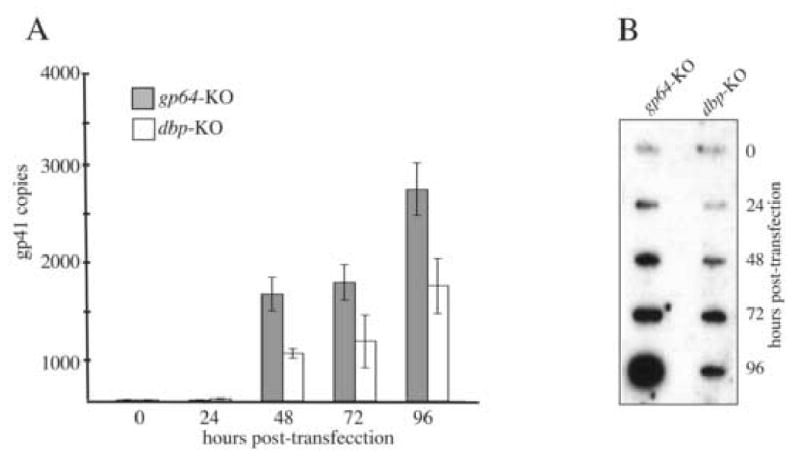
Analysis of viral DNA replication. (A) The bar graph represents the amount of nascent viral DNA synthesized in Sf-9 cells transfected with either the gp64 knockout virus serving as the non-infectious control or the dbp knockout virus. At the designated time-point, total DNA was isolated, treated with DpnI enzyme to digest input bacmid DNA, and analyzed by real-time PCR using a taqman probe and primer set that amplifies a 100 bp region of the AcMNPV gp41 open reading frame. The values displayed are the averages from transfections performed in triplicate with error bars indicating the standard deviations. (B) Slot-blot analysis of replicated viral DNA. At the indicated time-points, one well of a six-well plate of Sf-9 cells transfected with either the gp64 or dbp knockout virus was harvested at the indicated time points in 1 ml PBS and 100 μl of the cell suspension was removed, processed, and applied to nylon membrane using a slot-blot apparatus. The membrane was probed with 32P-labeled AcMNPV genomic DNA.
