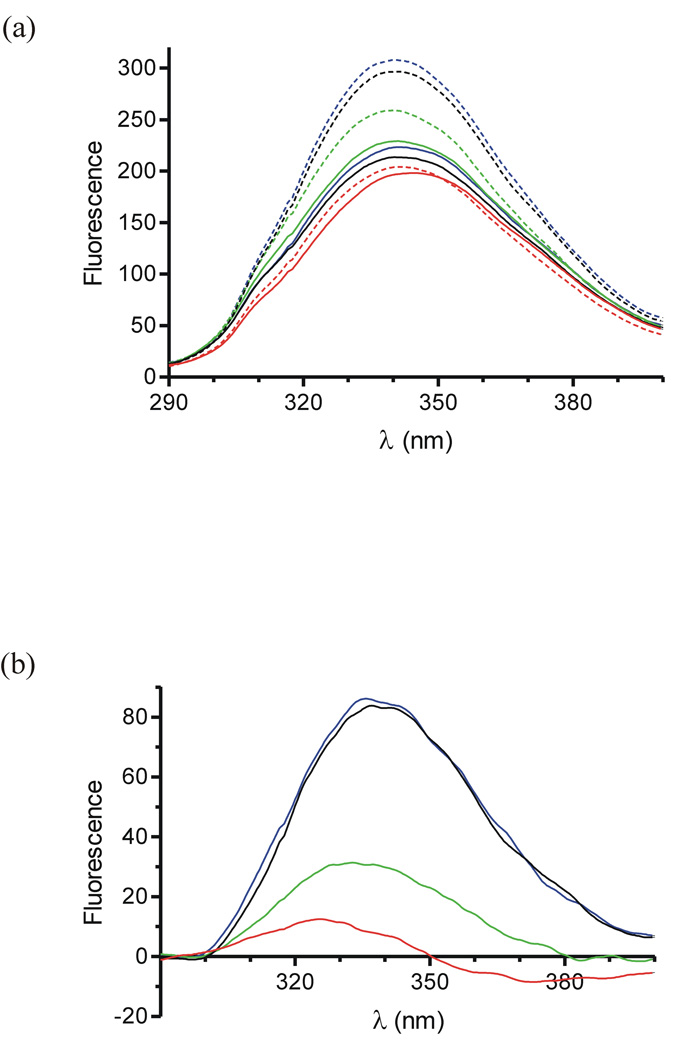
Figure 3.
Fluorescence spectra of AT variants. (a) The intrinsic fluorescence spectra of control (black), V375C (blue), S380C (green) and V375C/S380C (red) ATs in the absence (solid lines) and presence (dashed lines) of the pentasaccharide. (b) Difference spectra of curves shown in (a) reveal the fluorescence change due to the binding of the pentasaccharide to the variants of AT (coloured as in (a)).

