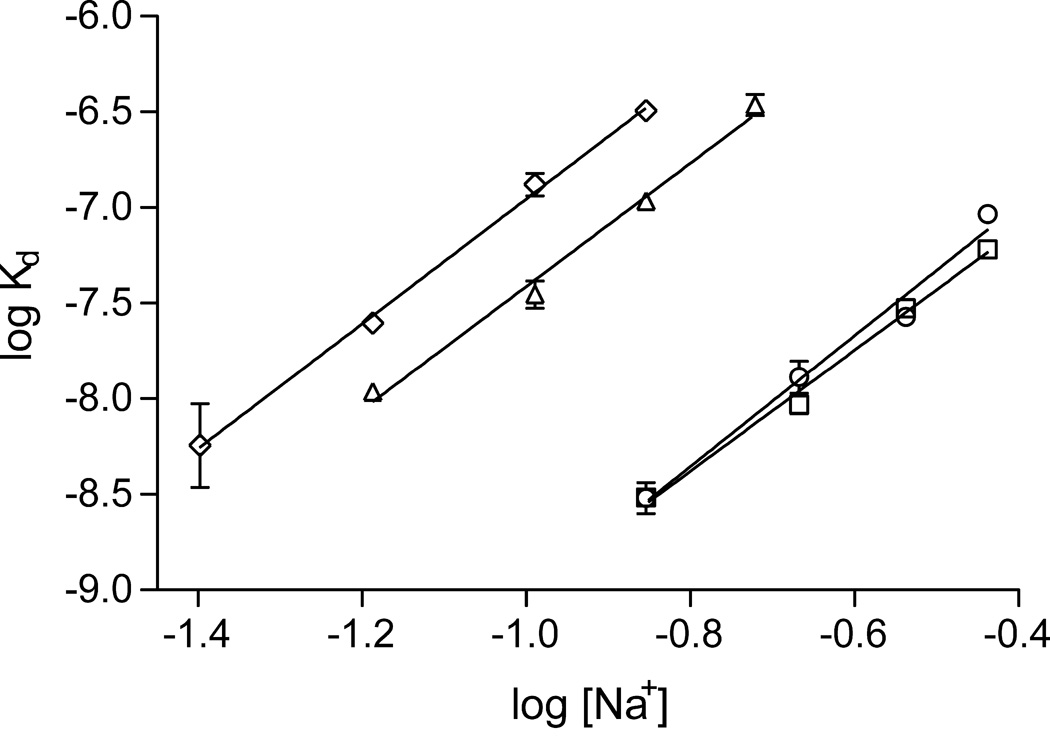
Figure 4.
Dependence of pentasaccharide affinity on Na+ concentration reveals the ionic and non-ionic contributions to binding. Linear regression of the double log plot gave identical slopes for all AT variants (control, circle; V375C, square; S380C, triangle; V375C/S380C, diamond), whereas the y-intercepts were significantly different for the S380C and double mutants, indicating a weaker non-ionic contribution to binding.

