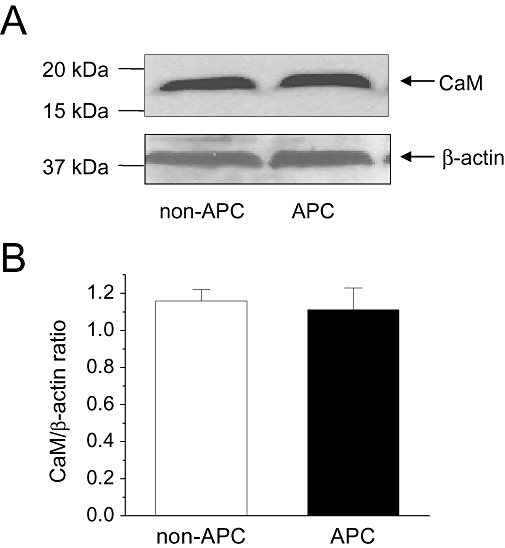
Figure 5.

Cytosolic calmodulin (CaM) levels. Effects of in vivo APC on cytosolic CaM levels were determined by Western blot. (A) Representative results from one heart each from the non-APC and APC groups are shown. β-actin was used as the loading control. (B) Summary of the CaM/β-actin ratio in the non-APC and APC groups are shown. No significant differences were observed between two groups (n = 6 hearts per group).
