
Figure 1.
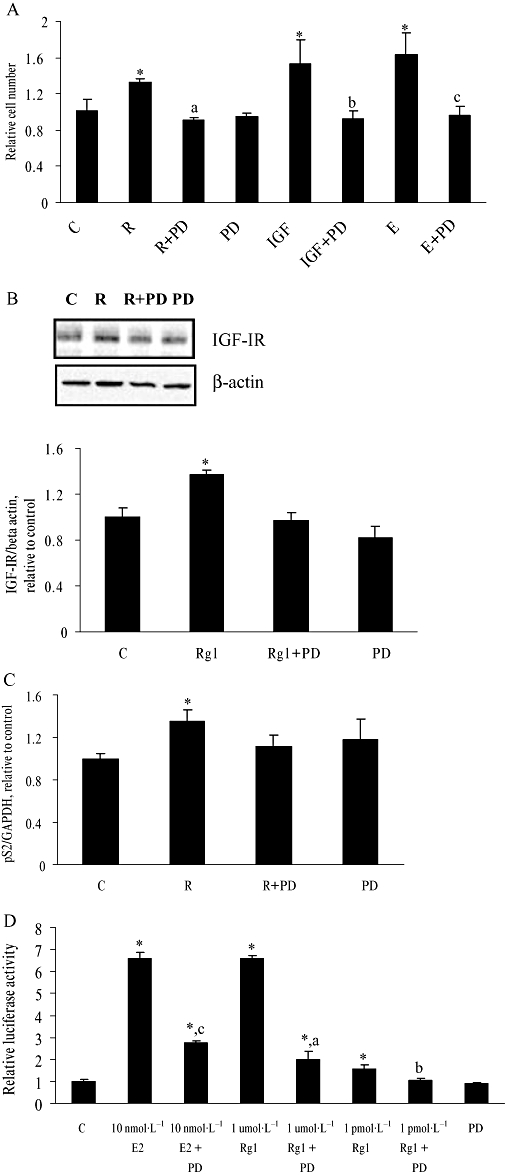
Effect of PD98059 on Rg1-induced cell proliferation, IGF-IR and pS2 expression, and ERE-containing promoter activities in human breast cancer (MCF-7) cells. (A) MCF-7 cells were treated with vehicle (C), 10 nmol·L−1 17(-oestradiol (E), 50 ng·mL−1 IGF-I (IGF) or 1 pmol·L−1 Rg1 (R) in the presence or absence of 50 (mol·L−1 PD98059 (PD) for 48 h. Cell number was then determined by MTS assay. The results are representative of three independent experiments and are expressed as means ± SEM. *P < 0.05 versus control, aP < 0.05 versus R, bP < 0.05 versus IGF, cP < 0.05 versus E, n = 3. (b,c) MCF-7 cells were treated with vehicle (C), 1 pmol·L−1 Rg1 (R) in the presence or absence of 50 (mol·L−1 PD98059 (PD) for 48 h. For (B), proteins were isolated and fractionated using 10% SDS-PAGE and subjected to Western blotting by using specific antibodies. The signals were detected and quantified by the Lumi-Imager. The lower panel shows the graphic representation of the IGF-IR protein expression level, which is expressed as a ratio to the expression of (-actin. For (C), total RNA was isolated and subjected to real-time RT-PCR analysis for pS2 and GAPDH. (D) MCF-7 cells were cotransfected with 0.7 µg of this reporter construct, together with 0.1 µg of an inactive control plasmid pRL-TK, a Renilla luciferase control vector using the Lipofectamine 2000 reagent according to the manufacture's instructions. At 6 h after transfection, the transfected MCF-7 cells were treated with vehicle (C), 1 pmol·L−1 Rg1, 1 (mol·L−1 Rg1 or 10 nmol·L−1 E2 in the presence or absence of 50 (mol·L−1 PD98059 (PD) for another 24 h. Activities of luciferase encoded by experimental and internal control plasmid were measured sequentially with the DLR assay reagents. The ERE firefly luciferase activities were normalized for pRL-TK Renilla luciferase values. One hundred per cent represents the ERE luciferase activity of the control. In (B), (C) and (D) the results were obtained from three independent experiments and expressed as mean ± SEM. *P < 0.05 versus control, aP < 0.05 versus 1 (mol·L−1 Rg1, bP < 0.05 versus 1 pmol·L−1 Rg1, cP < 0.05 versus 10 nmol·L−1 E2, n = 3.