
Figure 2.
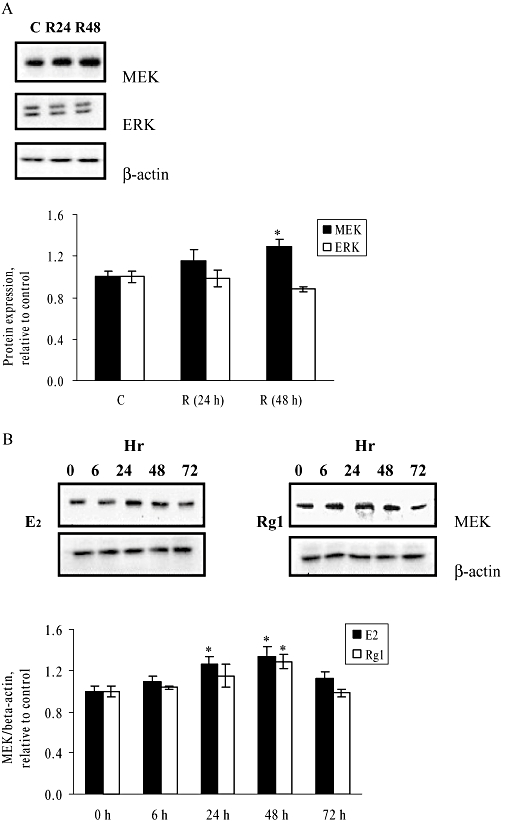
Effect of 1 pmol·L−1 Rg1 on protein expressions of MEK and ERK in MCF-7 cells. (A) MCF-7 cells were stimulated with vehicle (C) and 1 pmol·L−1 Rg1 for 24 or 48 h. After SDS-PAGE, blots were immunoblotted with specific antibodies. The signals were detected and quantified by the Lumi-Imager. The lower panel shows the graphic representation of the MEK and ERK protein expression levels, which are expressed as a ratio to the expression of (-actin. (B) MCF-7 cells were cultured and treated with 10 nmol·L−1 17(-oestradiol (E2) or 1 pmol·L−1 Rg1 (Rg1) for 0, 6, 24, 48 and 72 h. After SDS-PAGE, blots were immunoblotted with specific antibodies. The signals were detected and quantified by the Lumi-Imager. The lower panel shows the graphic representation of the MEK/(-actin protein expression level, which is expressed as a ratio to the basal reading where time 0 (untreated as basal) equals to 1. In (A) and (B) the results are representative of three independent experiments and are expressed as means ± SEM. *P < 0.05 versus control, n = 3.