
Figure 3.
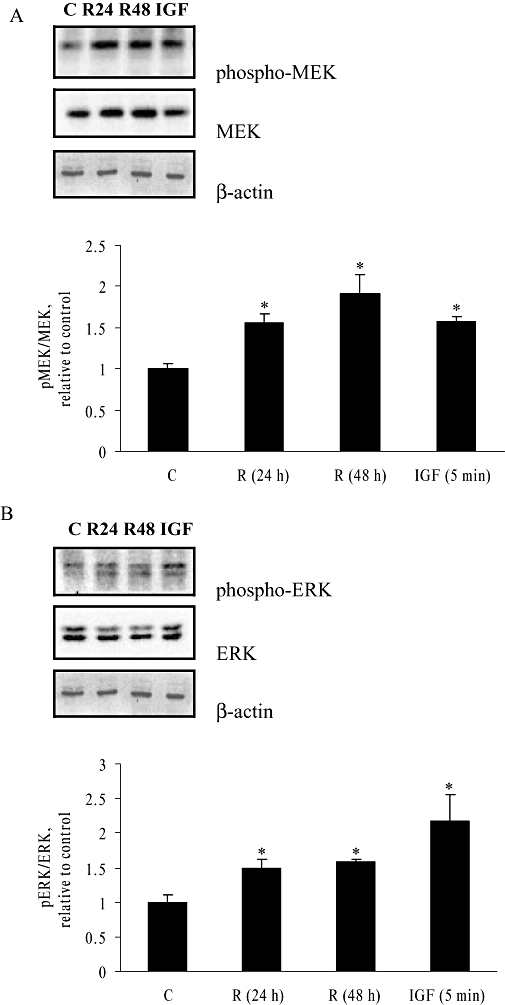
Effect of 1 pmol·L−1 Rg1 on MEK and ERK phosphorylation in MCF-7 cells. MCF-7 cells were stimulated with vehicle (C) and 1 pmol·L−1 Rg1 for 24 or 48 h. Stimulation by 50 ng·mL−1 IGF-I (IGF) for 5 min was used as a positive control. After SDS-PAGE, blots were immunoblotted with specific antibodies. The signals were detected and quantified by the Lumi-Imager. (A) Upper panel shows the immunoblot against phosphor-MEK, MEK and β-actin. Lower panel shows the graphical representation of the degree of phosphorylation, which is expressed as a ratio of pMEK to MEK. (B) Upper panel shows the immunoblot against phosphor-ERK, ERK and β-actin. Lower panel shows the graphical representation of the degree of phosphorylation which is expressed as a ratio of pERK to ERK. The results are representative of three independent experiments expressed as means ± SEM. *P < 0.05 versus control, n = 3.