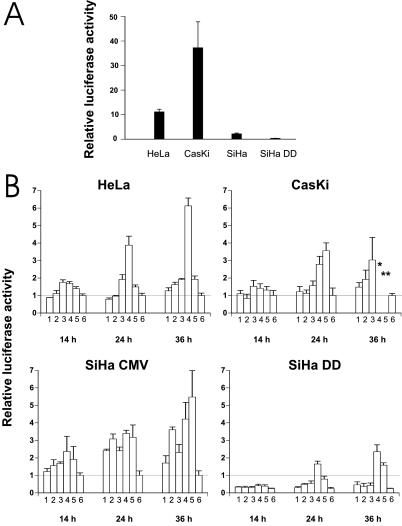
Figure 2.
(A) Endogenous transcriptional activation of the p53 responsive promoter PG13 and MG15 containing mutated binding site for p53. The values represent relative activities of PG13 versus MG15 construct. SiHa DD is a SiHa cell line stably transfected with a dominant negative p53 gene. (B) Transcriptional activation of p53 responsive promoter after treatment with LMB and AD. Twenty-four hours after the transfection, cell lines were treated with the drugs and thereafter analyzed for luciferase activity. The bars represent: 1, 20 nM LMB; 2, 200 nM LMB; 3, 5 nM AD; 4, 50 nM AD; 5, 20 nM LMB + 5 nM AD; 6, untreated cells. Values are expressed relative to the readings of untreated cells arbitrarily set to 1. SiHa DD values are calculated relative to untreated SiHa CMV cells. * and **, not enough living cells for reliable quantitation. SD was calculated from triplicate wells.

