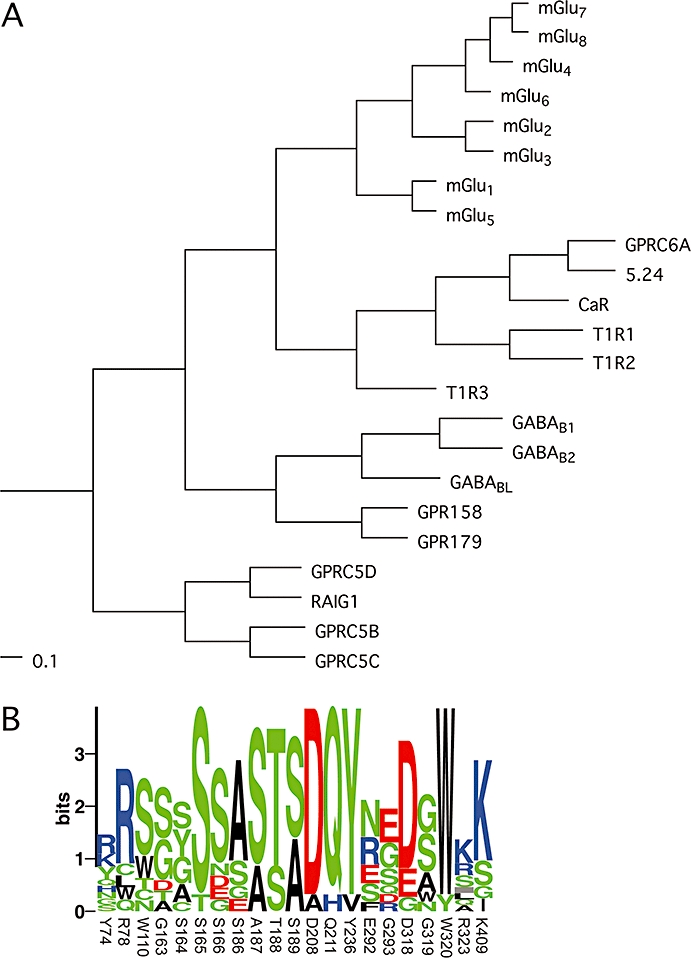
Figure 1.

(A) Phylogenetic analysis of family C GPCRs based on their seven transmembrane domains. A multiple sequence alignment of the predicted seven transmembrane domains was generated using the program ClustalX 2.0.9, and the shown phylograms were generated using the unweighted pair group method with arithmetic mean (UPGMA) algorithm and viewed with the program TreeviewX 0.5.0. The scale bars are a function of amino acid substitutions based on the Gonnet series substitution matrix. (B) Sequence logo of binding pocket residues in family C receptors, displaying the degree of conservation of each amino acid. Residues submitted are identical to those listed in Table 1 and numbers refer to the residue numbers in mGlu1. The height of each symbol is proportional to its frequency and colour coded according to polarity. The logo was generated using the server at the Center for Biological Sequence Analysis (http://www.cbs.dtu.dk/~gorodkin/appl/plogo.html) (Schneider and Stephens, 1990; Gorodkin et al., 1997). CaR, calcium-sensing receptor; GABAB, γ-aminobutyric acid type B; GPCR, G-protein-coupled receptor; GPRC6A, G-protein coupled receptor family C, group 6, subtype A; mGlu, metabotropic glutamate; T1R, taste1 receptor.
