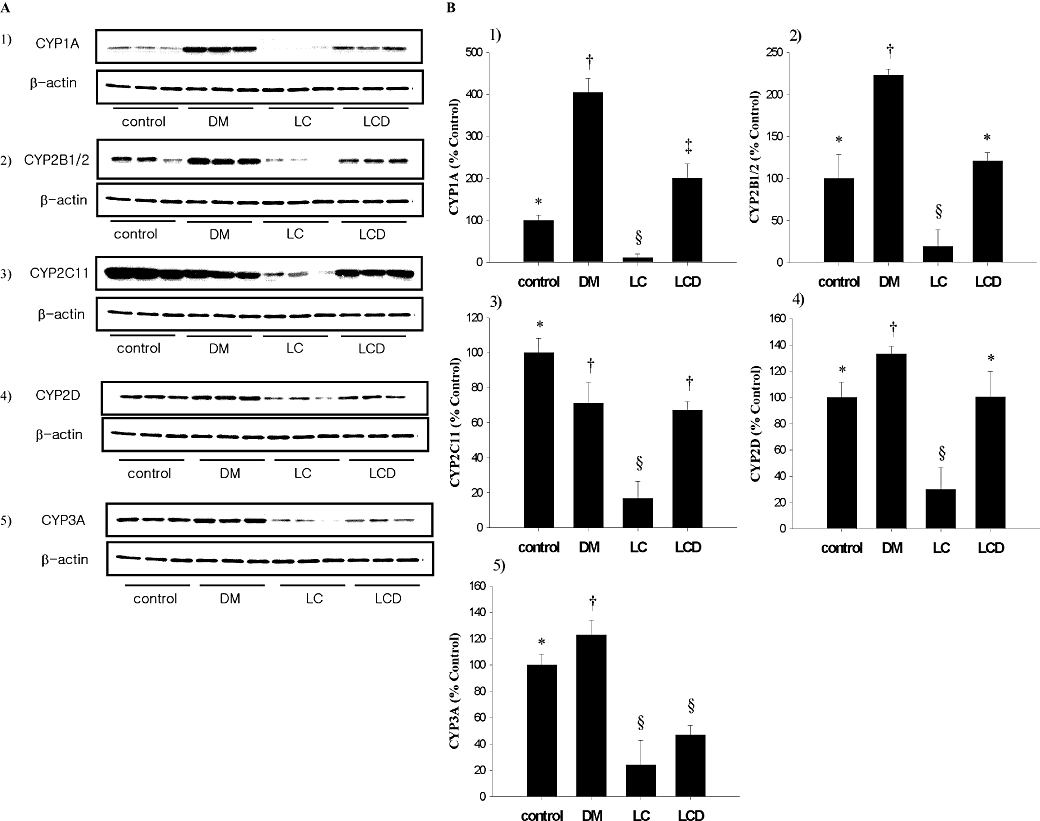
Figure 1.

Immunoblotting of hepatic CYP1A, 2B1/2, 2C11, 2D and 3A in LC, DM, LCD and control rats (A). Representative Western blots for each hepatic CYP isoform studied. The β-actin band was used as a loading control. (B). Summary data from the Western blots. The protein expression in LC DM and LCD groups was expressed in terms of that in control rats, set to 100%. Data are presented as mean ± SD and values with different marks (*, †, §, #) are significantly different (P < 0.05). (i) For CYP1A, all three experimental groups were different from control and each group was significantly different; (ii) For CYP2B1/2, only the DM group and the LC group were significantly different from control and the LCD groups; (iii) For CYP2C11, all three experimental groups were different from control and the LC group was different from the DM and LCD groups; (iv) For CYP2D, the DM and the LC groups were significantly different from control and the LCD groups (P < 0.05); and (v) For CYP3A, all three experimental groups were different from control (*P < 0.05) and the DM group was significantly different from the LC and LCD groups.
