Figure 2.

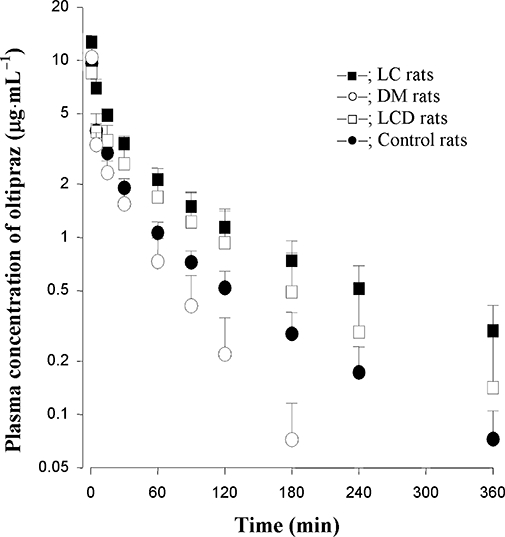
Mean arterial plasma concentration-time profiles of oltipraz after i.v. infusion at a dose of 10 mg·kg−1 to LC (n= 9), DM (n= 7), LCD (n= 7) and control (n= 8) rats. Data are presented as mean ± SD.

Mean arterial plasma concentration-time profiles of oltipraz after i.v. infusion at a dose of 10 mg·kg−1 to LC (n= 9), DM (n= 7), LCD (n= 7) and control (n= 8) rats. Data are presented as mean ± SD.