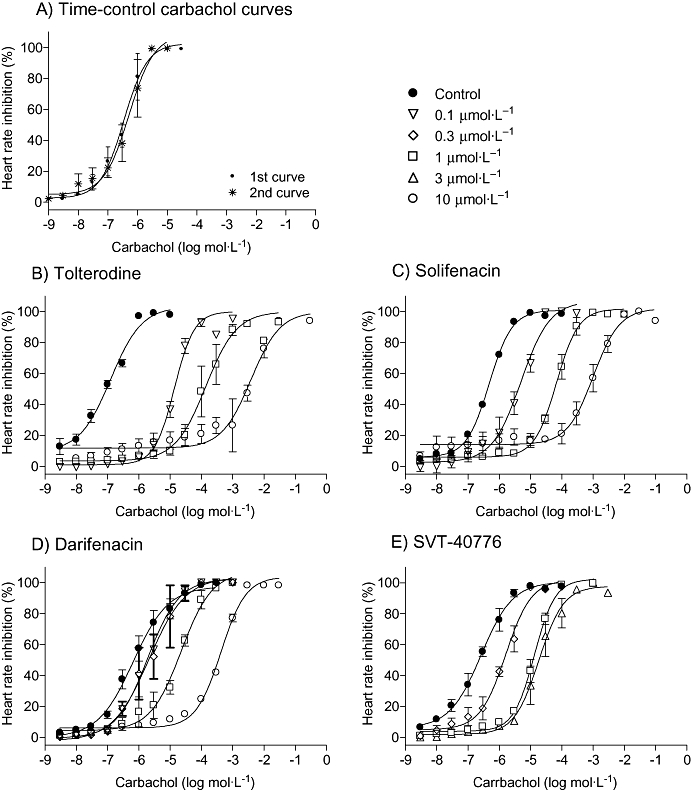
Figure 2.

Effect of tolterodine (B), solifenacin (C), darifenacin (D) and SVT-40776 (E) treatment on the cumulative consecutive concentration-response curves to carbachol (A) on mouse atria. As in Figure 1, the reproducibility of the control curves is shown in (A) and the effects of the antagonists (0.1–10 µmol·L−1) in (B)–(E). Direct contractile effects were expressed as percentages of the maximum response of the control curve. Data are expressed as mean ± SEM, n = 4–8 animals per concentration.
