
Figure 2.
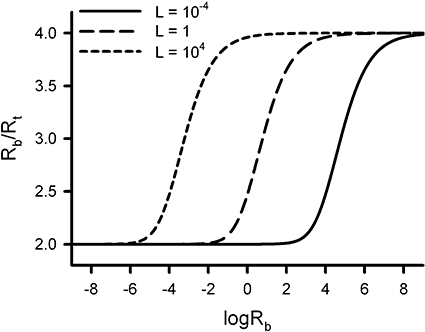
Variation of the number of receptor sites per receptor molecule (Rb/Rt) with the logarithm of the total concentration of receptor sites (logRb) for three values of the dimer/tetramer conversion constant (L), in the absence of ligand. The ordinate values range between 2 (dimer) and 4 (tetramer). The localization of the curves along the abscissa axis, which measures the proportion of dimers and tetramers for a given level of receptor expression (Rb), depends on L. The population of receptor tetramers increases as L increases.