
Figure 4.
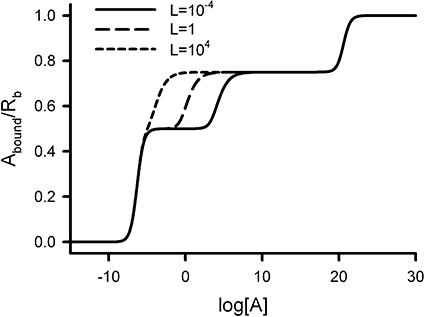
The dimer and tetramer model with interconvertible oligomeric states. The graph shows the variation of the amount of ligand bound per receptor site (Y = Abound/Rb) with the logarithm of ligand concentration (log[A]) for three values of the dimer/tetramer conversion constant (L). Fixed values used for the system parameters were Rb = 10−6, K1 = 10−6, K2 = 1020, K3 = 10−6, K4 = 10−6, K5 = 10−6 and K6 = 1020. Two intermediate plateaus are depicted at Y = 0.5 and 0.75.